YOR Topic #5: Regression Model of Combined Influences on Crop Yield
This analysis shows the relative and absolute influences of statistically significant predictors of crop yield, and will conclude our analysis of the YOR database. (Note: the regression modeling procedure identified five reports that contained data values that are too extreme to be readily modeled. Therefore, because the regression model is intended to predict crop yield for the vast majority of growers, these five reports, which were included in previous topics, will be eliminated from the final regression analysis. Thus, this analysis is based on 153 reports from the YOR database, instead of the 158 reports used for the other four topics.) It is important to note that a regression model identifies those influences that, in combination, have an impact on crop yield. This means that although our previous topics may have indicated many apparently important influences when each influence was measured in isolation from the others, this final regression analysis measures the unique influence of any given predictor when the influences of other predictors are controlled for.
Thus, a predictor that appeared to be important in an earlier analysis may no longer be deemed important based on the regression model. This is because its apparent influence is actually accounted for by another variable. How might this happen? Here’s a real-life example, taken from the annals of applied statistics:
Many years ago, a large-scale analysis was undertaken to identify predictors of the incidence of chronic childhood illness in various parts of the United States. Many influences were measured, and one of these influences was the number of miles of paved roadway in the county where any given child lived. However, when other influences such as amount of government and private spending on healthcare were included in the model, the influence of paved road mileage disappeared. It turns out, of course, that counties in which more money was spent on healthcare also tended to have larger budgets for road improvement: wealthier counties had healthier children. No surprise, but it points out the importance of including as many variables as possible in the analysis simultaneously, instead of just looking at single influences one at a time.
Here are the key influences on crop yield, listed in order of strength, with the associated regression coefficients shown in parentheses. The regression coefficient indicates how much change in crop yield will result from a one-unit change in the value of the predictor (measured in units appropriate to that particular predictor):
So, in total, our regression model is explaining about 53% of the variation in crop yield that is seen in the YOR database. Because of the limited sample size (153 reports), the lack of scientific controls on growers’ observations and reports, and the YOR’s inability to capture all significant influences on crop yield, being able to explain 53% of crop yield variation is actually very good.
So we can see that "Lumens" is more than twice as influential as the next-best predictor (% HPS lumens). Because with the "Lumens" predictor we have already accounted for amount of light being generated, the "% HPS lumens" variable probably represents the superior spectral properties of HPS lighting as well as its superior ability to penetrate farther down into the grow space (high intensity). "Grower Experience" (denoted by the YOR report sequence number) also has some effect; and "Hydroponic Medium" rounds out the list. (The benefits of a hydroponic medium are probably due to its superior ability to aerate the roots better than soil can, while also supplying the necessary moisture and nutrients.)
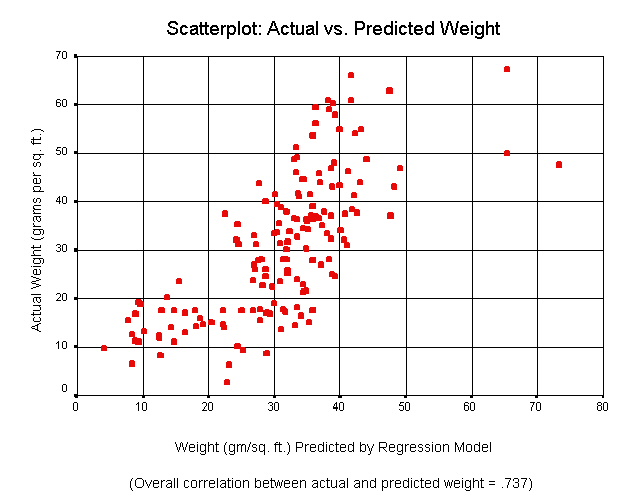
The graph below shows a scatterplot of predicted weight (on the X-axis) by actual weight (on the Y-axis):
Here we can see that there is a fairly good correspondence between predicted and actual weight, indicating that the model is a good one. As the footnote in the graph indicates, the overall correlation between predicted and actual weight is .737 (compared with a maximum theoretical coefficient of 1.00.) If we square this number and then do some adjustments for our sample size, we arrive at a value of about .53. This means that we are explaining about 53% of the database’s variation in crop yield using just these four predictors. And while some people might think this isn’t a very good model, it actually is. In fact, it is rarely possible to explain anywhere near all of the variation in data such as those we are working with here. There are undoubtedly many subtle influences not captured in the YOR database. In addition, there is probably some error in the reporting of the data by growers.
Note: as a follow-up to this analysis, pH is putting together an Excel worksheet that will allow growers to input various numbers representing their lumen levels, etc., and that will then calculate likely crop yield for the user. His program will also include canopy size, so that total crop yield (rather than just yield per square foot) will be calculated and reported.
Conclusions
The regression model tells us quite simply that if a grower wants to maximize crop yield, then he should use plenty of light (preferably HPS lighting, because of its superior spectral properties and its canopy-penetrating power). He should also use a hydroponic medium that provides not only good moisture retention but also good aeration, which is a balance that soil growing simply cannot deliver as well as hydroponics/aeroponics can. And, finally, experience is also an important factor in obtaining higher crop yields. But hopefully, in the future, even those with little or no experience can grow bigger crops, now that we have clarified the key influences on crop yield. Our main goal in the analysis of the YOR data has been to provide a short-cut to success, so that new growers will not have to go down a long and painful learning curve in order to achieve good results. We hope it helps.