Topic #4: Miscellaneous Influences on Crop Yield
(CO2 enrichment / active venting; primary / secondary yield-limiting factors)
This topic covers three of the YOR cypher fields:
CO2 enrichment / venting
Here are the cypher4 codes. The letters at the left of the ‘=’ will be displayed on the horizontal axis if they are represented by any of the 158 YOR records we are analyzing.
Cypher#4 CO2 ENRICHMENT AND/OR ACTIVE VENTING (venting only if no CO2)
A=
B=
C=CO2 NOT used, no active venting
D=CO2 NOT used, constant venting
E=CO2 NOT used, automatic or timed venting
F=CO2 NOT used, manual venting
G=
H=
I=CO2 Generator, flame
J=CO2 Generator, flame, auto vent
K=
L=
M=
N=CO2 Generator, chemical
O=CO2 Generator, chemical, auto vent
P=
Q=
R=
S=CO2 Tank, manual release
T=CO2 Tank, manual release, auto vent
U=CO2 Tank, flow ctrl, sol release
V=CO2 Tank, Flow ctrl, sol release, auto vent
W=
X=CO2, Dry Ice
Y=
Z=
-=N/A
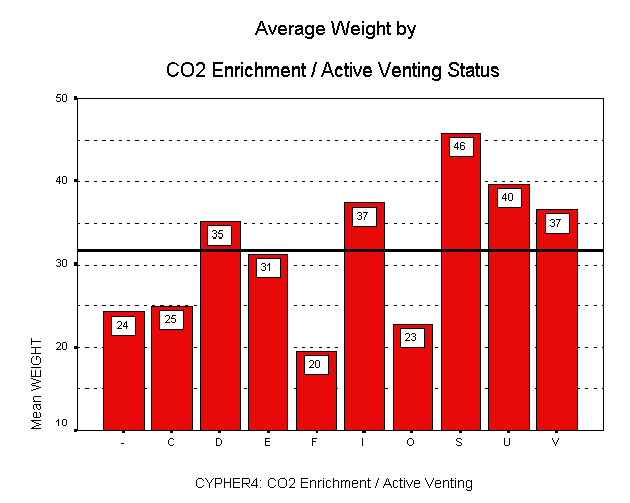
And here is the graph of CO2 / venting by crop weight (grams per square foot). The horizontal line in the middle of the graph represents the overall average value for crop weight (31.573 grams):
We must be careful when interpreting the above graph, however, because of small sample sizes for some of the values. The only two categories above that deviate to a statistically significant degree from the overall average weight are ‘D’ (CO2 NOT used, constant venting), which is significantly above average; and ‘F’ (CO2 NOT used, manual venting), which is significantly below average. For completeness, here is the frequency distribution of values for the cypher4 field:
So, given our limited sample, all we can conclude with statistical confidence is that, when not using CO2, constant venting produces above-average yields, while manual venting produces below-average yields. [E.g., in the case of values ‘I’, ‘S’, ‘U’ and ‘V’, which seem to be above-average, there are either too few reports having the given value for us to be able to draw firm conclusions, or there is too much variation in weight among the reports having a given value.]
Primary limiting factors
Here we examine the grower-perceived primary limiting factors. The codes to the left of the ‘=’ will be displayed on the horizontal axis of the graph below:
What improvements would you make?
Cypher#6 PRIMARY and SECONDARY LIMITING FACTORS ON YIELD
A=Light Intensity
B=Nutrient Mix
C=Irrigation Schedule
D=Growing Medium
E=Water Source
F=Variety
G=Flowering Time
H=Venting
I=Insects/Vermin
J=Unexpected Equipment or Plant Failures
K=Fungus/Mold
L=Gardener Laziness
M=Temperature/Humidity
N=Electrical or Power Company Problems
O=Unattended Garden During Long Holiday
P=Paranoia
Q=pH Control
R=Other People
S=No Limiting Factors (I'm satisfied with the yield)
T=Harvested or Flowered Too Soon or Canopy Not Full
U=Container Size
V=Growth Control/Pruning
W=This was my First Crop.
X=Experiment(s) Conducted
Y=I don't know the limiting factor & NOT satisfied with the yield
Z=
-=N/A
Here is the graph. Again, the horizontal line in the middle of the graph depicts the overall average yield for our sample of 158 YOR records:
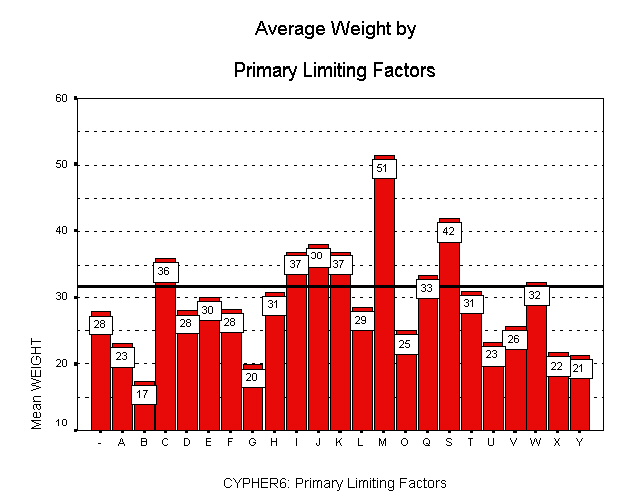
Here are the primary limiting factors that are associated with statistically significant, below-average yields:
A=Light Intensity
B=Nutrient Mix
G=Flowering Time
X=Experiment(s) Conducted
I am assuming that the ‘Flowering Time’ reference indicates that the crop was harvested earlier than the grower would have preferred. Note also that although value ‘Y’ appears to be below average, there is only one report for this value, so the sample is too small to draw a reliable conclusion. For completeness, here is the frequency distribution of values for the cypher6 field:
Secondary limiting factors
The same listing of factors for cypher6 is also used for the cypher7 field (see above). Here is the graph. Again, the horizontal line across the middle of the graph represents the overall sample average weight:
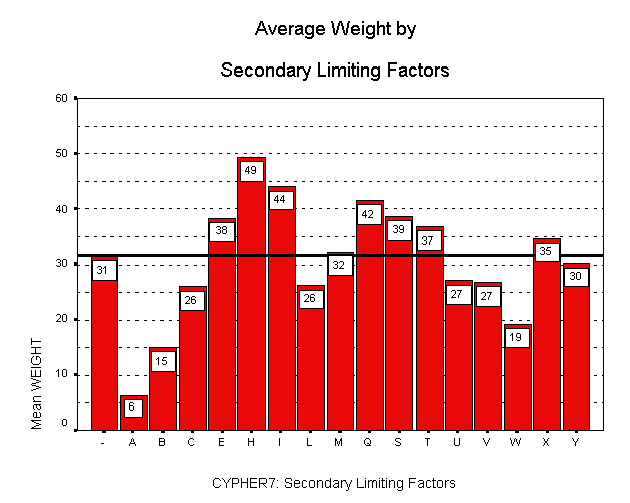
The grower-perceived secondary factors that we may associate (with statistical confidence) with below-average yield are:
A=Light Intensity
W=This was my First Crop
Once again, some values in the graph may appear to be below average, but we cannot say so with confidence, either because of small samples or because of too much variation in weight across reports represented by a given value. For completeness, here is the frequency distribution of values for the cypher7 field:
Conclusions
As might be expected from prior anecdotal evidence, the YOR data tend to support the superiority of constant venting over manual venting, when CO2 enhancement is not used. In addition, and also not surprisingly, according to self-reported perceptions, the key factors limiting crop yield seem to be: