Topic #3:
Plant-related factors
This analysis covers the influence of four plant-related factors on crop yield (measured as weight in grams per square foot):
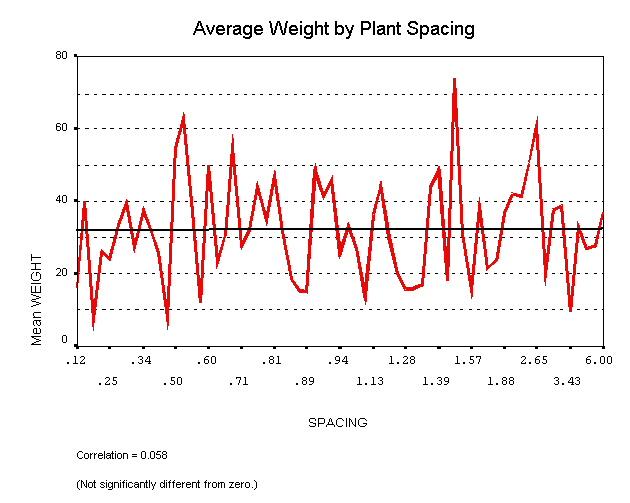
Plant spacing
Perhaps it seems at first counter-intuitive, but there is no measurable influence of plant spacing on crop yield. Here is a line graph showing the relationship. The units on the horizontal axis represent the number of plants per square foot of canopy, and the vertical axis represents average crop yield (grams per square foot):
The footnote at the bottom of the graph indicates that the correlation between spacing and weight is only 0.058, which is not significantly different from zero. (A correlation represents the overall relationship between two variables. If larger values of one variable are associated with larger values of the other variable, and smaller values of one variable are likewise associated with smaller values of the other variable, then there is a positive correlation. If larger values of one variable are associated with smaller values of the other variable, then the two variables are negatively correlated. A correlation coefficient can range from –1.00 to +1.00. A correlation of zero indicates that there is no association between the two variables: the values of one variable cannot be predicted from knowledge of the values of the other variable.)
The lack of clear relationship persists even if we collapse the raw data for the two variables into a smaller number of categories in order to "smooth" it. Because no clear relationship exists, one might speculate that as the canopy gets more crowded, the increase in actual plant material per square foot is offset by the reduction in light that actually gets to various important parts of the plant, primarily the sun leaves.
If the plants get too crowded, leaves just below the canopy will tend to wither and die, and bud formation will suffer significantly down there. Conversely, if plants are given a lot of space, then the plant will be bathed in light; but of course there will be correspondingly less total yield because there are fewer plants. Probably the best advice is to set spacing so that most or all of the sun leaves receive plenty of light. Many experts say that the leaves of adjacent plants may touch each other, but they should not overlap noticeably. (Note also the extreme sawtoothed pattern in the graph, indicating that there are other influences at play here, which may be dwarfing any slight influence of spacing.)
Days spent in flowering
Here is another finding that may at first seem counter-intuitive: number of days spent in the flowering phase does not have any appreciable influence on yield per square foot. Here is the graph:
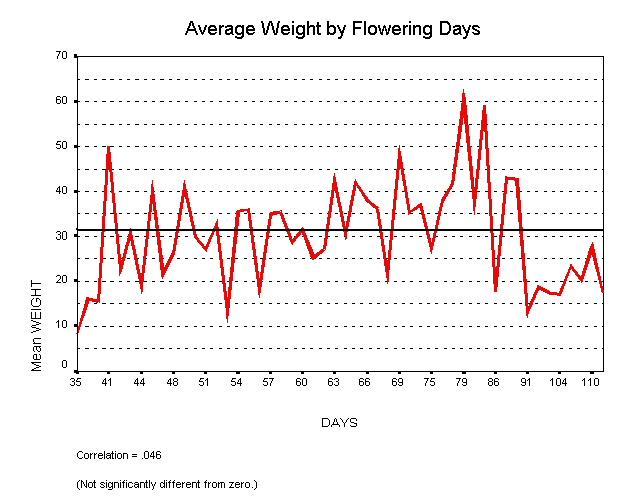
As the footnote in the graph indicates, the overall correlation between flowering days and weight is only 0.046, which is not significantly different from zero. Here one might speculate that there are many varieties of plant represented in the YOR database, and that different varieties may have radically different lengths of natural flowering duration. Many varieties may take several months to finish, while some have been known to finish in less than eight weeks. This is probably an important factor in the lack of overall relationship between length of flowering and weight per square foot. We might also suspect that light intensity (and perhaps other factors) is influencing things, as indicated by the extreme sawtoothed pattern in the graph.
Primary method of growth control (YOR cypher3 field)
Because the descriptions of the various categories of the cypher3 field are too long to include on the horizontal axis of the upcoming graph, we will lay out a data dictionary here first, copied/pasted directly from the YOR posting instructions. The alphabetic code letters at the far left will be shown on the graph’s axis:
Cypher#3 PRIMARY METHOD OF GROWTH CONTROL
A=
B=Shoot Pruning
C=
D=
E=Bending/Crimping
F=
G=
H=Tying
I=
J=
K=Natural, no controls
L=Natural,topped only @<1ft
M=Natural,topped only 1-2ft
N=Natural,topped only 2-3ft
O=Natural,topped only 3ft+
P=Pyraponics
Q=
R=
S=Sea of Green (SOG)
T=Trellis (ScrOG, conventional horzontal Screen Of Green)
U=Trellis * (h/bog, H-shaped box ScrOG designed to surround the sides
of a horizontal lamp)
V=
W=
X=
Y=
Z=
-=N/A
NOTE: Trellis "/bog" entries are variations of ScrOG specially
adapted for small cabinet, or box, installations usually
employing a very high light intensity. They are terms to
describe a lamp suspended completely within an enclosed
"box of green" (bog), with only enough gaps to clear the
lamp attachments. The h or v prefix differentiates a lamp
fixed vertically or horizontally.
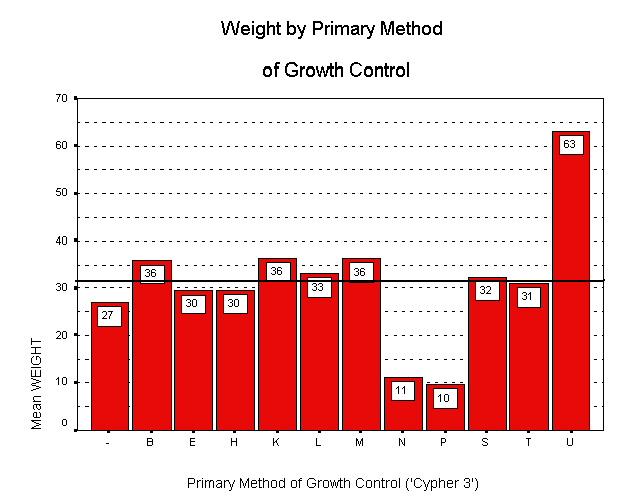
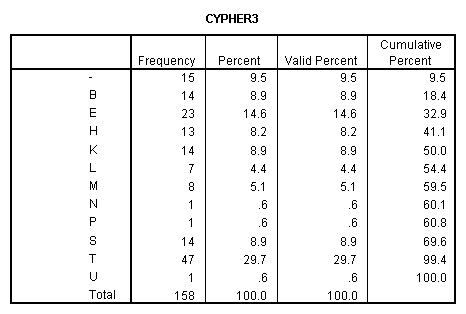
While at first it may seem that there are important influences at work here, actually there is no statistically significant relationship between any of the growth control methods and crop yield. (The values ‘N’, ‘P’ and ‘U’ represent only one report each, which is not enough of a sample to allow us to draw any statistically reliable conclusions.) For completeness, here is the frequency distribution of the values of the cypher3 field:
Plant stock
Lastly, we will now examine the influence of plant stock on crop yield. Here we finally see a significant relationship, depicted in the following graph:
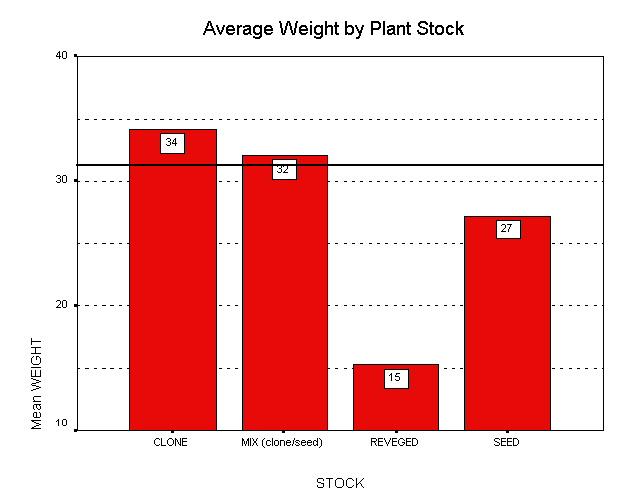
Here we can see that clones produce the highest yield, followed closely by clone/seed mix. Seed stock yields significantly less, and revegetated stock produces very low yield. This last finding confirms much anecdotal evidence discussed at a.d.p.c. indicating that revegetated plants will always produce much less yield than they did in the initial grow.