The single most important influence on crop yield is light intensity (lumens per square foot of growing area). So we have chosen lighting characteristics as our first topic in the analysis of the Special YOR database containing 158 grow reports. [NOTE: unless otherwise specified, all key analyses of the Special YOR database will be based on the same 158 grow reports referred to by pH in his a.d.p.c. Special YOR post.]
However, before we show graphs of findings, we first present the following two tables (created by pH). The first table shows the available lumens per square foot produced by various bulb types and wattages. It is useful for determining the lumen level produced by your specific equipment, as well as for seeing the various ways that a given lumen level can be achieved by alternative types/sizes of equipment. It is also helpful for estimating electricity costs associated with various bulb types and wattages that can be used to produce a given lumen level. (By multiplying your equipment's wattage by the number of kilowatt hours per day that it is running, then multiplying the result by 30 [days], and finally multiplying this result by your local energy cost [$ per kilowatt hour], you will arrive at the approximate monthly operating cost.)
COLUMNS ARE ARRANGED IN ORDER OF BULB SIZE
|
4'FL |
4'FL |
|||||||||||||||
|
Gro |
cw/ww |
MH |
HPS |
MH |
HPS |
MH |
MH |
HPS |
MH |
HPS |
HPS |
HPS |
MH |
HPS |
MH |
|
|
40 |
40 |
70 |
70 |
100 |
100 |
175 |
250 |
250 |
400 |
400 |
430 |
600 |
1000 |
1000 |
1500 |
Available |
|
Lumens/Sq Ft |
||||||||||||||||
|
733 |
413 |
465 |
379 |
407 |
359 |
398 |
393 |
295 |
344 |
268 |
273 |
228 |
275 |
244 |
320 |
33000 |
|
711 |
400 |
451 |
368 |
395 |
348 |
386 |
381 |
286 |
333 |
260 |
264 |
221 |
267 |
237 |
311 |
32000 |
|
689 |
388 |
437 |
356 |
383 |
337 |
373 |
369 |
277 |
323 |
252 |
256 |
214 |
258 |
230 |
301 |
31000 |
|
667 |
375 |
423 |
345 |
370 |
326 |
361 |
357 |
268 |
313 |
244 |
248 |
207 |
250 |
222 |
291 |
30000 |
|
644 |
363 |
408 |
333 |
358 |
315 |
349 |
345 |
259 |
302 |
236 |
240 |
200 |
242 |
215 |
282 |
29000 |
|
622 |
350 |
394 |
322 |
346 |
304 |
337 |
333 |
250 |
292 |
228 |
231 |
193 |
233 |
207 |
272 |
28000 |
|
600 |
338 |
380 |
310 |
333 |
293 |
325 |
321 |
241 |
281 |
220 |
223 |
186 |
225 |
200 |
262 |
27000 |
|
578 |
325 |
366 |
299 |
321 |
283 |
313 |
310 |
232 |
271 |
211 |
215 |
179 |
217 |
193 |
252 |
26000 |
|
556 |
313 |
352 |
287 |
309 |
272 |
301 |
298 |
223 |
260 |
203 |
207 |
172 |
208 |
185 |
243 |
25000 |
|
533 |
300 |
338 |
276 |
296 |
261 |
289 |
286 |
214 |
250 |
195 |
198 |
166 |
200 |
178 |
233 |
24000 |
|
511 |
288 |
324 |
264 |
284 |
250 |
277 |
274 |
205 |
240 |
187 |
190 |
159 |
192 |
170 |
223 |
23000 |
|
489 |
275 |
310 |
253 |
272 |
239 |
265 |
262 |
196 |
229 |
179 |
182 |
152 |
183 |
163 |
214 |
22000 |
|
467 |
263 |
296 |
241 |
259 |
228 |
253 |
250 |
188 |
219 |
171 |
174 |
145 |
175 |
156 |
204 |
21000 |
|
444 |
250 |
282 |
230 |
247 |
217 |
241 |
238 |
179 |
208 |
163 |
165 |
138 |
167 |
148 |
194 |
20000 |
|
422 |
238 |
268 |
218 |
235 |
207 |
229 |
226 |
170 |
198 |
154 |
157 |
131 |
158 |
141 |
184 |
19000 |
|
400 |
225 |
254 |
207 |
222 |
196 |
217 |
214 |
161 |
188 |
146 |
149 |
124 |
150 |
133 |
175 |
18000 |
|
378 |
213 |
239 |
195 |
210 |
185 |
205 |
202 |
152 |
177 |
138 |
140 |
117 |
142 |
126 |
165 |
17000 |
|
356 |
200 |
225 |
184 |
198 |
174 |
193 |
190 |
143 |
167 |
130 |
132 |
110 |
133 |
119 |
155 |
16000 |
|
333 |
188 |
211 |
172 |
185 |
163 |
181 |
179 |
134 |
156 |
122 |
124 |
103 |
125 |
111 |
146 |
15000 |
|
311 |
175 |
197 |
161 |
173 |
152 |
169 |
167 |
125 |
146 |
114 |
116 |
97 |
117 |
104 |
136 |
14000 |
|
289 |
163 |
183 |
149 |
160 |
141 |
157 |
155 |
116 |
135 |
106 |
107 |
90 |
108 |
96 |
126 |
13000 |
|
267 |
150 |
169 |
138 |
148 |
130 |
145 |
143 |
107 |
125 |
98 |
99 |
83 |
100 |
89 |
117 |
12000 |
|
244 |
138 |
155 |
126 |
136 |
120 |
133 |
131 |
98 |
115 |
89 |
91 |
76 |
92 |
81 |
107 |
11000 |
|
222 |
125 |
141 |
115 |
123 |
109 |
120 |
119 |
89 |
104 |
81 |
83 |
69 |
83 |
74 |
97 |
10000 |
|
200 |
113 |
127 |
103 |
111 |
98 |
108 |
107 |
80 |
94 |
73 |
74 |
62 |
75 |
67 |
87 |
9000 |
|
178 |
100 |
113 |
92 |
99 |
87 |
96 |
95 |
71 |
83 |
65 |
66 |
55 |
67 |
59 |
78 |
8000 |
|
156 |
88 |
99 |
80 |
86 |
76 |
84 |
83 |
63 |
73 |
57 |
58 |
48 |
58 |
52 |
68 |
7000 |
|
133 |
75 |
85 |
69 |
74 |
65 |
72 |
71 |
54 |
63 |
49 |
50 |
41 |
50 |
44 |
58 |
6000 |
|
111 |
63 |
70 |
57 |
62 |
54 |
60 |
60 |
45 |
52 |
41 |
41 |
34 |
42 |
37 |
49 |
5000 |
|
89 |
50 |
56 |
46 |
49 |
43 |
48 |
48 |
36 |
42 |
33 |
33 |
28 |
33 |
30 |
39 |
4000 |
|
67 |
38 |
42 |
34 |
37 |
33 |
36 |
36 |
27 |
31 |
24 |
25 |
21 |
25 |
22 |
29 |
3000 |
|
44 |
25 |
28 |
23 |
25 |
22 |
24 |
24 |
18 |
21 |
16 |
17 |
14 |
17 |
15 |
19 |
2000 |
|
22 |
13 |
14 |
11 |
12 |
11 |
12 |
12 |
9 |
10 |
8 |
8 |
7 |
8 |
7 |
10 |
1000 |
|
0 |
The second table (from pH) shows the approximate square feet of light coverage required to produce a given level of lumens per sq. ft., for various types/sizes of light.
COLUMNS ARE ARRANGED IN ORDER OF BULB SIZE
|
4'FL |
4'FL |
|
|
|
|
|
|
|
|
|
|
|
|
|
|
|
|
Gro |
cw/ww |
MH |
HPS |
MH |
HPS |
MH |
MH |
HPS |
MH |
HPS |
HPS |
HPS |
MH |
HPS |
MH |
|
|
40 |
40 |
70 |
70 |
100 |
100 |
175 |
250 |
250 |
400 |
400 |
430 |
600 |
1000 |
1000 |
1500 |
Available |
|
|
|
|
|
|
|
|
|
|
|
|
|
|
|
|
|
Lumens/Sq. Ft. |
|
0 |
0 |
0 |
0 |
0 |
0 |
0 |
1 |
1 |
1 |
1 |
2 |
3 |
4 |
4 |
5 |
33000 |
|
0 |
0 |
0 |
0 |
0 |
0 |
0 |
1 |
1 |
1 |
2 |
2 |
3 |
4 |
4 |
5 |
32000 |
|
0 |
0 |
0 |
0 |
0 |
0 |
0 |
1 |
1 |
1 |
2 |
2 |
3 |
4 |
4 |
5 |
31000 |
|
0 |
0 |
0 |
0 |
0 |
0 |
0 |
1 |
1 |
1 |
2 |
2 |
3 |
4 |
5 |
5 |
30000 |
|
0 |
0 |
0 |
0 |
0 |
0 |
1 |
1 |
1 |
1 |
2 |
2 |
3 |
4 |
5 |
5 |
29000 |
|
0 |
0 |
0 |
0 |
0 |
0 |
1 |
1 |
1 |
1 |
2 |
2 |
3 |
4 |
5 |
6 |
28000 |
|
0 |
0 |
0 |
0 |
0 |
0 |
1 |
1 |
1 |
1 |
2 |
2 |
3 |
4 |
5 |
6 |
27000 |
|
0 |
0 |
0 |
0 |
0 |
0 |
1 |
1 |
1 |
1 |
2 |
2 |
3 |
5 |
5 |
6 |
26000 |
|
0 |
0 |
0 |
0 |
0 |
0 |
1 |
1 |
1 |
2 |
2 |
2 |
3 |
5 |
5 |
6 |
25000 |
|
0 |
0 |
0 |
0 |
0 |
0 |
1 |
1 |
1 |
2 |
2 |
2 |
4 |
5 |
6 |
6 |
24000 |
|
0 |
0 |
0 |
0 |
0 |
0 |
1 |
1 |
1 |
2 |
2 |
2 |
4 |
5 |
6 |
7 |
23000 |
|
0 |
0 |
0 |
0 |
0 |
0 |
1 |
1 |
1 |
2 |
2 |
2 |
4 |
5 |
6 |
7 |
22000 |
|
0 |
0 |
0 |
0 |
0 |
0 |
1 |
1 |
1 |
2 |
2 |
2 |
4 |
6 |
6 |
7 |
21000 |
|
0 |
0 |
0 |
0 |
0 |
0 |
1 |
1 |
1 |
2 |
2 |
3 |
4 |
6 |
7 |
8 |
20000 |
|
0 |
0 |
0 |
0 |
0 |
0 |
1 |
1 |
1 |
2 |
3 |
3 |
5 |
6 |
7 |
8 |
19000 |
|
0 |
0 |
0 |
0 |
0 |
1 |
1 |
1 |
2 |
2 |
3 |
3 |
5 |
7 |
8 |
9 |
18000 |
|
0 |
0 |
0 |
0 |
0 |
1 |
1 |
1 |
2 |
2 |
3 |
3 |
5 |
7 |
8 |
9 |
17000 |
|
0 |
0 |
0 |
0 |
1 |
1 |
1 |
1 |
2 |
2 |
3 |
3 |
5 |
8 |
8 |
10 |
16000 |
|
0 |
0 |
0 |
0 |
1 |
1 |
1 |
1 |
2 |
3 |
3 |
3 |
6 |
8 |
9 |
10 |
15000 |
|
0 |
0 |
0 |
0 |
1 |
1 |
1 |
2 |
2 |
3 |
4 |
4 |
6 |
9 |
10 |
11 |
14000 |
|
0 |
0 |
0 |
0 |
1 |
1 |
1 |
2 |
2 |
3 |
4 |
4 |
7 |
9 |
10 |
12 |
13000 |
|
0 |
0 |
0 |
1 |
1 |
1 |
1 |
2 |
2 |
3 |
4 |
4 |
7 |
10 |
11 |
13 |
12000 |
|
0 |
0 |
0 |
1 |
1 |
1 |
1 |
2 |
3 |
3 |
4 |
5 |
8 |
11 |
12 |
14 |
11000 |
|
0 |
0 |
0 |
1 |
1 |
1 |
1 |
2 |
3 |
4 |
5 |
5 |
9 |
12 |
14 |
15 |
10000 |
|
0 |
0 |
1 |
1 |
1 |
1 |
2 |
2 |
3 |
4 |
5 |
6 |
10 |
13 |
15 |
17 |
9000 |
|
0 |
0 |
1 |
1 |
1 |
1 |
2 |
3 |
4 |
5 |
6 |
7 |
11 |
15 |
17 |
19 |
8000 |
|
0 |
0 |
1 |
1 |
1 |
1 |
2 |
3 |
4 |
5 |
7 |
7 |
12 |
17 |
19 |
22 |
7000 |
|
0 |
1 |
1 |
1 |
1 |
2 |
2 |
4 |
5 |
6 |
8 |
9 |
15 |
20 |
23 |
26 |
6000 |
|
0 |
1 |
1 |
1 |
2 |
2 |
3 |
4 |
6 |
8 |
10 |
10 |
17 |
24 |
27 |
31 |
5000 |
|
0 |
1 |
1 |
2 |
2 |
2 |
4 |
5 |
7 |
10 |
12 |
13 |
22 |
30 |
34 |
39 |
4000 |
|
1 |
1 |
2 |
2 |
3 |
3 |
5 |
7 |
9 |
13 |
16 |
17 |
29 |
40 |
45 |
52 |
3000 |
|
1 |
2 |
2 |
3 |
4 |
5 |
7 |
11 |
14 |
19 |
25 |
26 |
44 |
60 |
68 |
77 |
2000 |
|
2 |
3 |
5 |
6 |
8 |
9 |
15 |
21 |
28 |
38 |
49 |
52 |
87 |
120 |
135 |
155 |
1000 |
|
|
|
|
|
|
|
|
|
|
|
|
|
|
|
|
|
0 |
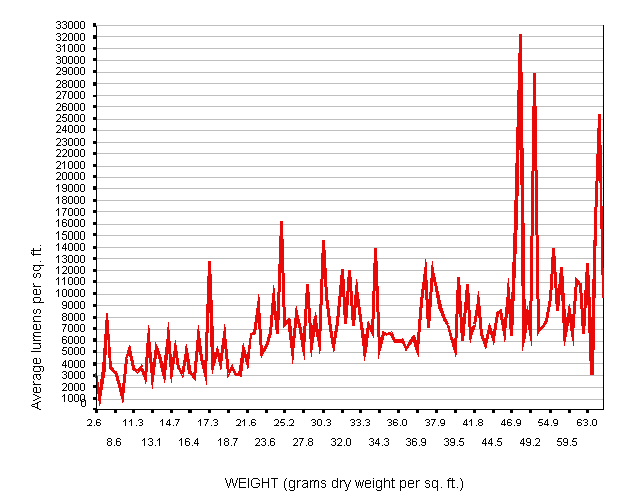
The following graph shows the relationship between average lumens and crop yield. Note that the lumen scale is the same as in the table above. Once you have determined the lumen level produced by your setup, you can see what the expected crop yield is at that lumen level. However, note that the first graph shows a saw-tooth pattern instead of a smooth line. This is due to the fact that there are many other factors affecting crop yield besides just light intensity. Also, although it may be difficult to see from the graph, there is a point at which an extremely high lumen level does not appear to increase crop yield appreciably. This will become more apparent in the second graph, which is a "smoothed" version of the first graph.
Weight (grams per sq. ft.) produced by various light intensities (average lumens per square foot)
[NOTE: to avoid crowding the labels of the horizontal axis, above, we have provided labels only for every seventh grow report.]
To make it easier to see what's going on, in the second graph we have smoothed the line displayed in the first graph. To do this, we collapsed the raw data on the horizontal (crop yield) axis into 10 groups. Each group represents an average of actual grams per sq. ft. taken across approximately 16 grow reports. [NOTE: because we are working with a total of 158 grow reports, each of the 10 categories below represents a grouping of approximately 16 grow reports.] The horizontal axis labels indicate the range of actual grams represented by the collapsed category.
Light intensities (average lumens per square foot) associated with 10 Weight groups (grams per sq. ft.)
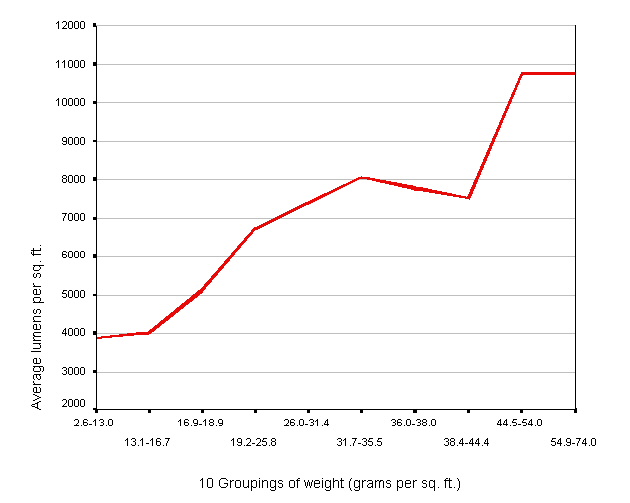
Here we can now see that the average lumens associated with the two highest weight categories are about 11,000. Additional analyses (not detailed here) indicate that above about 14,000 lumens per sq. ft., the grower will tend to get diminishing returns on crop yield. Thus, a practical ceiling on light efficiency appears to exist at about 14,000 lumens.
END OF TOPIC #1