Four graphs of weight by lumens (Base: 96 HPS-only YOR records)

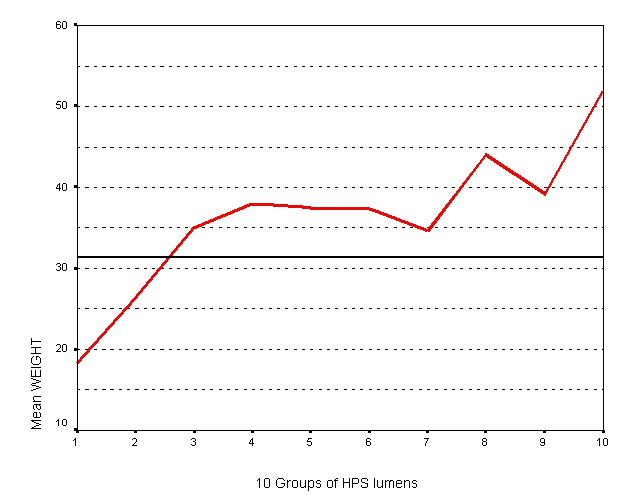
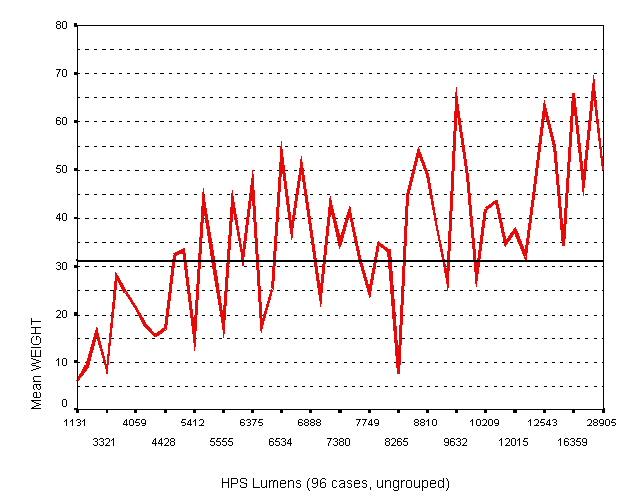
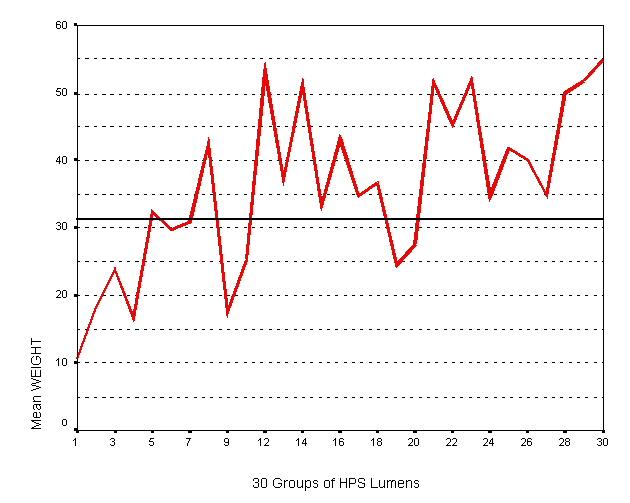
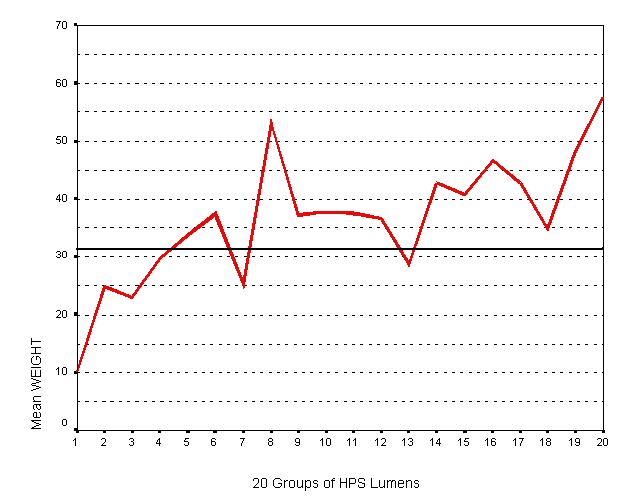
Here are four graphs of weight (grams per sq. ft.) plotted by decreasingly precise values for HPS lumens (96 ungrouped records; 29 groupings; 20 groupings; 10 groupings):


For the next graph, using 29 groups of HPS lumens, here are the ranges of actual HPS lumens w/in each group, and a count of the number of reports in each group:

Groups (29) Range of lumens Count

1                     1131 - 3210                 3

2                     3321 - 3690                 2

3                     3813 - 4059                 4

4                     4144 - 4428                 3

5                     5166 - 5166                 2

6                     5289 - 5412                 5

7                     5488 - 5555                 3

8                     5658 - 6375                 4

9                     6413 - 6413                 1

10                   6519 - 6519                 6

11                   6534 - 6534                 5

12                   6642 - 6642                 6

13                   6765 - 6765                 1

14                   6888 - 7011                 3

15                   7250 - 7250                 2

16                   7380 - 7380                 4

17                   7500 - 7626                 2

18                   7749 - 7749                 4

19                   7872 - 8265                 4

20                   8288 - 8505                 4

21                   8810 - 8856                 3

22                   8979 - 9632                 3

23                   9744 - 9840                 3

24                   10209 - 10209             2

25                   10824 - 12000            5

26                   12015 - 12091            2

27                   12300 - 12543           4

28                   13899 - 16359           3

29                   16500 - 28905           3

For the next graph, using 20 groups of HPS lumens, here are the ranges of actual HPS lumens w/in each group, and a count of the number of reports in each group:

Groups (20) Range of lumens Count

1                     1131 - 3321             4

2                     3690 - 4059             5

3                     4144 - 5166             5

4                     5289 - 5412             5

5                     5488 - 6150             5

6                     6375 - 6413             3

7                     6519 - 6519             6

8                     6534 - 6534             5

9                     6642 - 6642             6

10                   6765 - 7011             4

11                   7250 - 7380             6

12                   7500 - 7626             2

13                   7749 - 7965             7

14                   8265 - 8505             5

15                   8810 - 8979             4

16                   9632 - 9840             5

17                 10209 - 10824           5

18                 12000 - 12091           4

19                 12300 - 13915           6

20                 16359 - 28905           4


For the next graph, using 10 groups of HPS lumens, here are the ranges of actual HPS lumens w/in each group, and a count of the number of reports in each group:

Groups (10) Range of lumens Count

1                     1131 - 4059             9

2                     4144 - 5412           10

3                     5488 - 6413             8

4                     6519 - 6534           11

5                     6642 - 7011           10

6                     7250 - 7626             8

7                     7749 - 8505           12

8                     8810 - 9840             9

9                   10209 - 12091           9

10                 12300 - 28905        10